📊 Market Overview
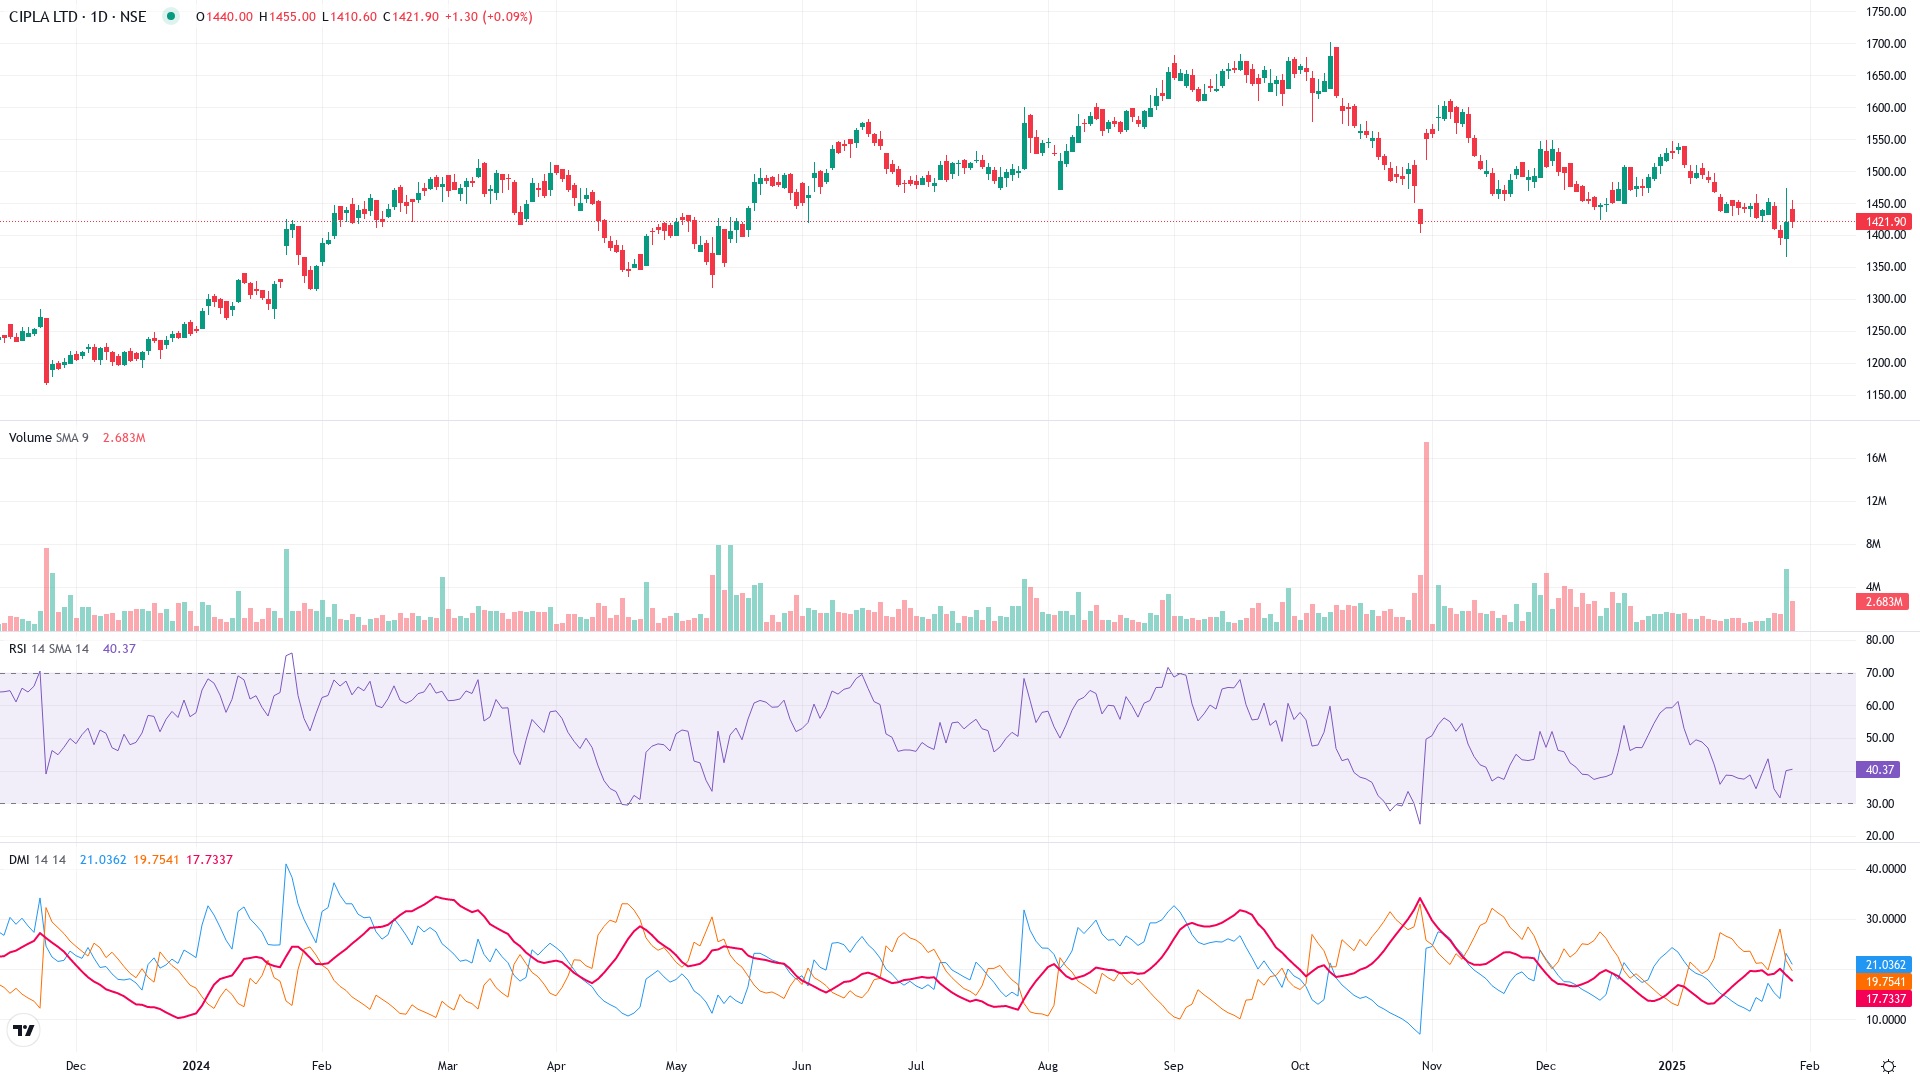
Stock Name: Cipla Ltd. (NSE: CIPLA)
Last Traded Price: ₹1421.90 (+1.30, +0.09%)
Analysis Period: Daily chart covering approximately 1 year, from late 2023 to early 2025.
🎯 Key Technical Analysis
💫 Price Action Dynamics
- 1-Year Trend: Strong uptrend from late 2023 to mid-2024, followed by a downtrend from August 2024 to the present.
- Key Support Levels: ₹1400 (short-term support), ₹1320-1350 (strong historical support). Break below ₹1320 could signify further weakness.
- Key Resistance Levels: ₹1450-1460 (nearest short-term resistance), ₹1500 (psychological and technical resistance).
- Recent Candlestick Insights: A bounce-back from the ₹1400 mark with mixed momentum. Bullish follow-through above ₹1450 is critical for upside potential.
📈 Technical Indicators Breakdown
RSI (14) Analysis
- Current Reading: 40.37 (neutral-bearish territory).
- Insights: Historically tested oversold line (30) during corrections. Current reading indicates weakening bearish momentum but lacks strong bullish confirmation.
DMI (Directional Movement Index) Analysis
- Current Setup:
- DI+: 19.75 (below DI-, indicates weaker bullish momentum).
- DI-: 17.73 (narrowly crossing above DI+ recently).
- ADX: 21.03 (weak trend strength, suggesting choppy price action likely).
- Interpretation: Downtrend weakening slightly. DI+ vs. DI- crossover signals sideways or bullish transition if resistance levels are cleared.
📊 Volume Analysis
- Current Volume: ~2.68M (relatively higher than average).
- Volume Trends:
- Significant volume spikes during downtrends (e.g., December 2024 and October 2024 corrections).
- Recent recovery attempts are accompanied by moderate volume, suggesting cautious buyer participation.
💪 Technical Strength Assessment
| Metric | Score (/10) |
|---|---|
| Price Action | 6/10 |
| RSI Momentum | 5/10 |
| DMI/ADX Strength | 4/10 |
| Volume Participation | 6/10 |
| Overall Technical Score | 5.25/10 |
⚠️ Risk Analysis
- Potential Downside Break: Failure to hold ₹1400 support could lead to declines toward ₹1320-1350 levels.
- Weak Buying Momentum: Lack of conviction in current recovery attempts as reflected in volume trends.
- Broad Market Volatility: Broader market movements (Nifty50, sector rotation) can influence Cipla’s price action significantly.
Disclaimer
Technical analysis is subject to market uncertainties and does not guarantee specific results. Always consult with a financial advisor before making investment decisions.
Analysis limitations:
- Analysis is based on historical price action and indicators, which may not fully capture future market behavior.
- Reliance Industries was briefly mentioned but not analyzed comprehensively due to the focus on Cipla’s chart.