📊 Market Overview
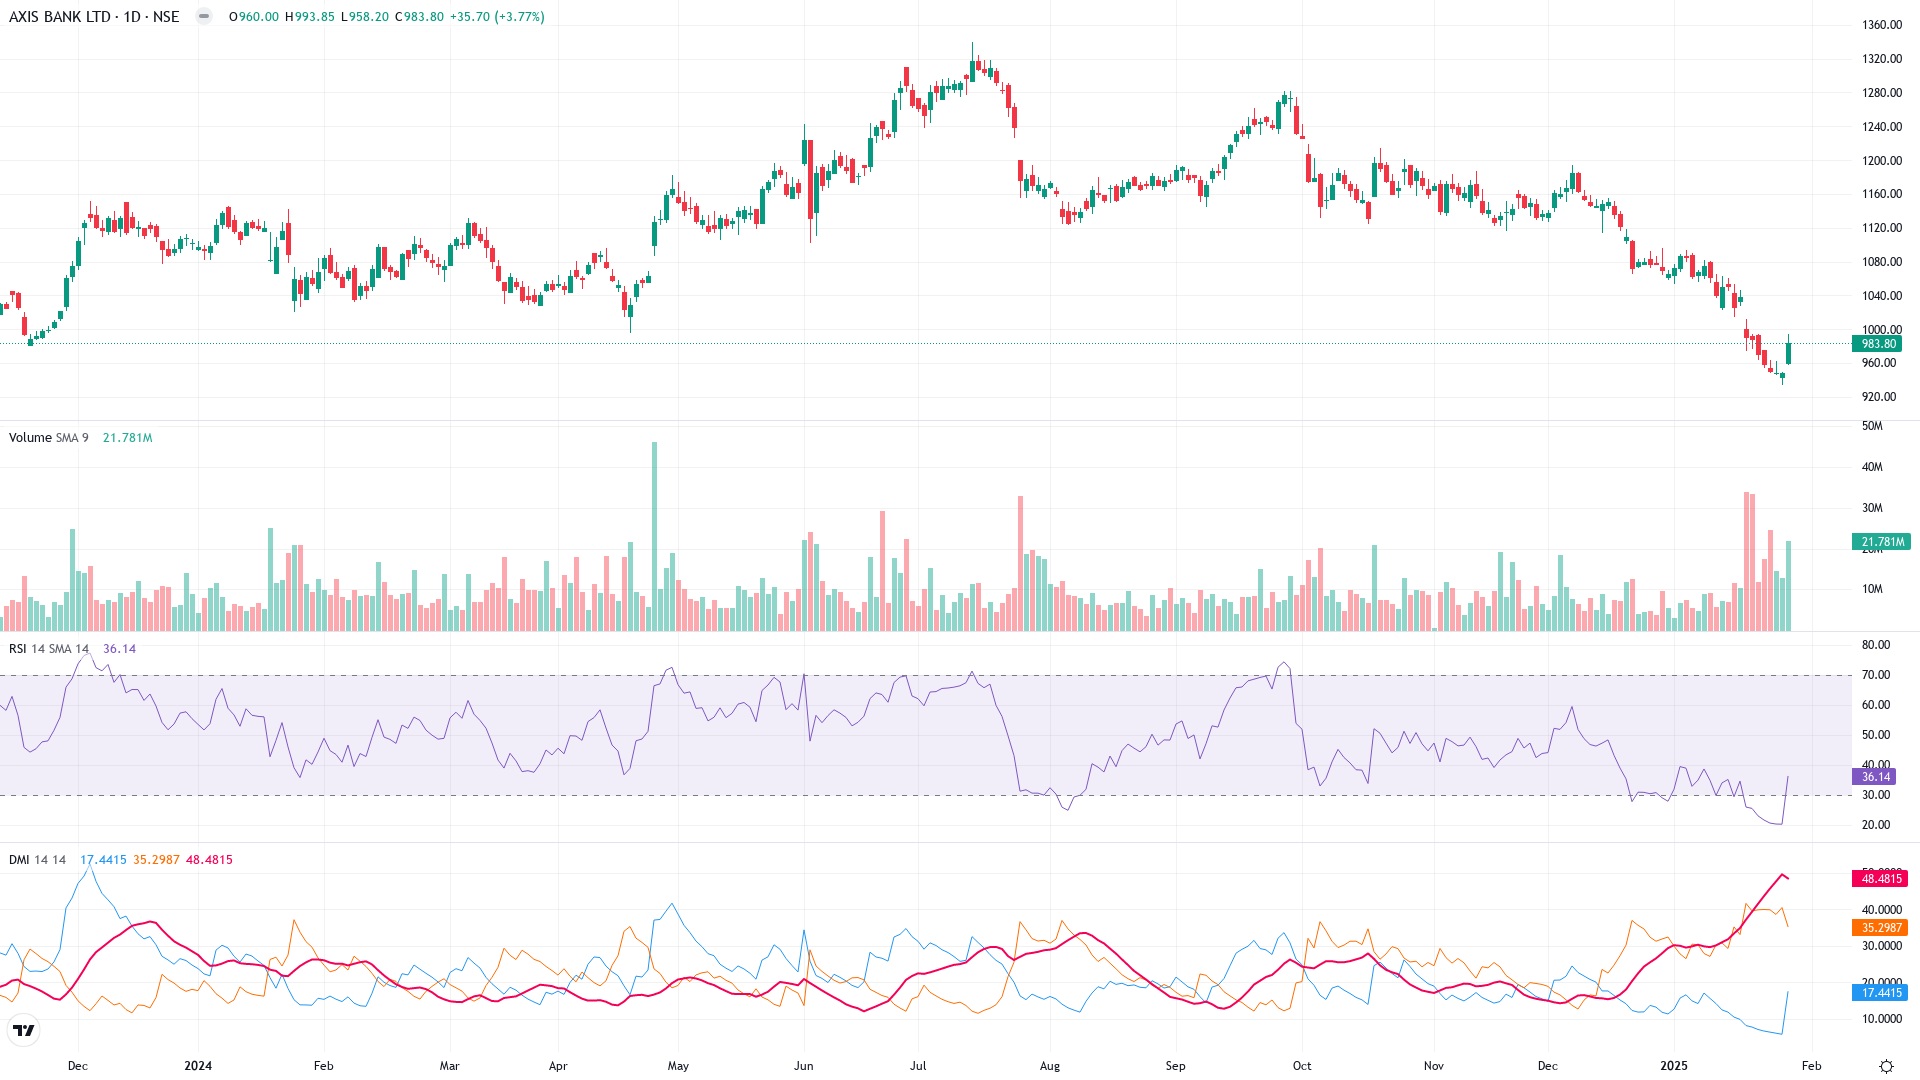
Current Price: ₹983.80 (+35.70, +3.77%)
Analysis Period: Recent session performance and multi-month downtrend observation
🎯 Key Technical Analysis
💫 Price Action Dynamics
- Primary Trend: Downtrend since August 2024, marked by lower highs and lower lows.
- Recent Close: ₹983.80, reflecting a strong rebound (+3.77%) in the latest session.
- Support Levels: Strong support between ₹940-960 (recently tested).
- Resistance Levels:
- Near-term resistance: ₹1,000-1,020 zone (psychological and prior breakdown level).
- Higher resistance: ₹1,080-1,100 (major supply zone).
- The stock recently rebounded from the oversold region near ₹940, indicating potential short-term recovery.
📈 Technical Indicators Breakdown
- RSI (14):
- Current Reading: 36.14 (approaching neutral from oversold).
- RSI below 30 during the recent downtrend reflected weakness, while current recovery shows potential bullish momentum.
- Key Level: RSI needs to break over 50 for stronger recovery signals.
- DMI (Directional Movement Index):
- DI+ (35.29) remains below DI- (48.48), confirming bearish dominance.
- ADX (48): Indicates a strong bearish trend. A crossover (DI+ overtaking DI-) is required to confirm trend reversal.
📊 Volume Analysis
Volume spiked in the latest session, aligning with the price bounce. Increased volumes at support zones are typical of accumulation or reversal attempts. Prior volume patterns reflected enhanced selling pressure during the downtrend.
💪 Technical Strength Assessment
| Metric | Score (out of 10) |
|---|---|
| Price Action | 7/10 |
| RSI Momentum | 6/10 |
| DMI/Trend Strength | 5/10 |
| Volume Profile | 8/10 |
| Pattern Formation | 6/10 |
| Overall Technical Score | 6.4/10 |
⚠️ Risk Analysis
- A failure to sustain above ₹940 could lead to further downside, with next support around ₹880-900.
- High ADX values (48) highlight that bearish momentum remains strong despite the recent bounce.
- No confirmation of trend reversal until ₹1,020 is decisively breached with volume.
- Macro factors like interest rates or sector performance could affect banking stocks negatively.
Disclaimer
This analysis is for informational purposes only and should not be considered financial advice. Investments in equities are subject to market risks, and past performance is not indicative of future results. Always consult a financial advisor before making trading or investment decisions.
The analysis is based on the available data and technical indicators, which are inherently subject to limitations such as lag and false signals in highly volatile markets.