📊 Market Overview
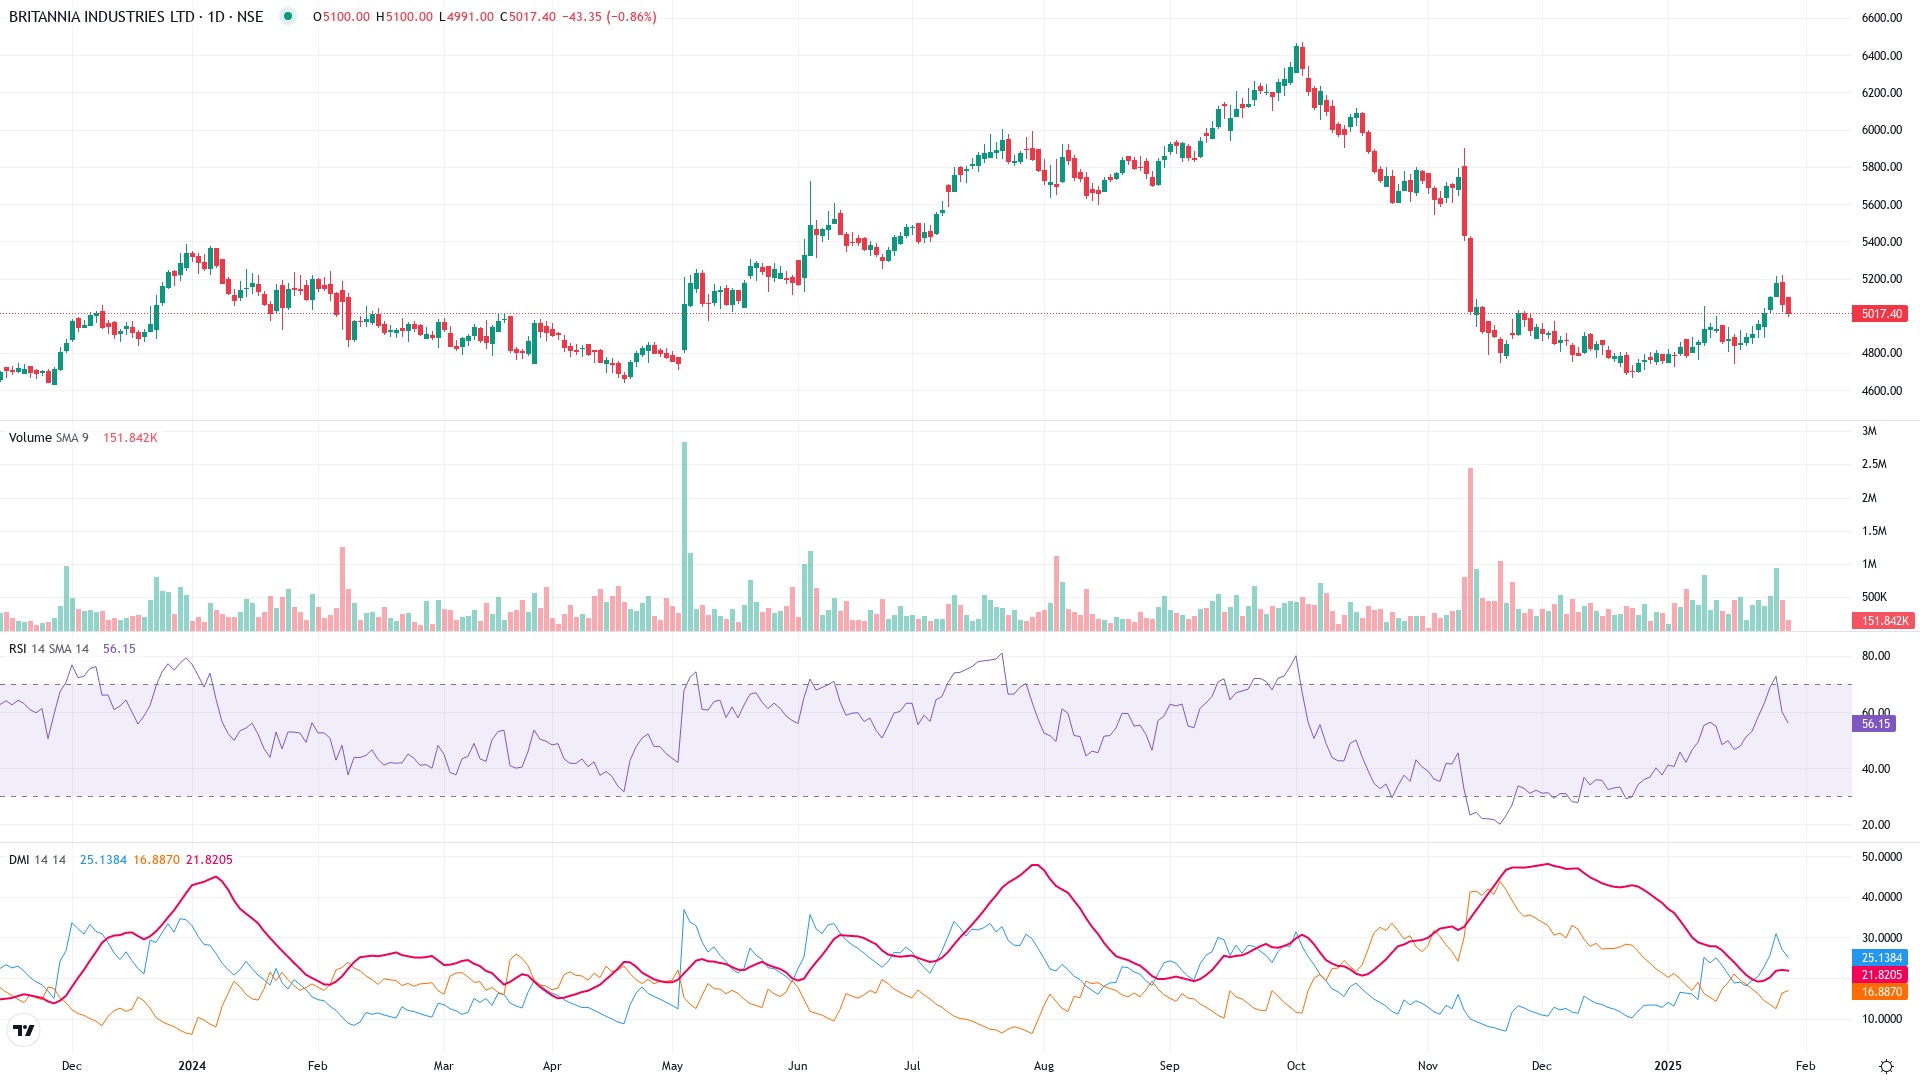
Security: Britannia Industries Ltd
Exchange: NSE
Current Price: ₹5017.40 (-₹43.35, -0.86%)
Analysis Period: January 2025
🎯 Key Technical Analysis
💫 Price Action Dynamics
- From early 2024 to August 2024, Britannia experienced a strong uptrend, peaking above ₹6600.
- Since August 2024, the stock has been in a downtrend, entering a consolidation phase in November 2024.
- Currently, the price is attempting a recovery from ₹4800 to over ₹5200 but faces critical resistance between ₹5200-5400.
- ₹4800 serves as a strong support; breaching this level could signal further downside.
📈 Technical Indicators Breakdown
- Relative Strength Index (RSI – 14):
- Current reading: 56.15, transitioning to a slightly bullish zone.
- Historical note: RSI breached oversold levels (<30) in November 2024 and is recovering cautiously.
- Directional Movement Index (DMI – 14):
- DI+ (25.13) above DI- (21.82) indicates bullish momentum.
- ADX (16.89) points to a weak trend, signaling limited conviction in the recovery.
- Volume:
- Recovery from ₹4800 witnessed above-average buying volumes.
- However, recent volume (151.82K) is tapering off, indicating reduced momentum.
📊 Volume Analysis
During the recovery phase, volumes supported the bounce-back above ₹4800, but tapering activity suggests a lack of follow-through strength at current levels.
💪 Technical Strength Assessment
| Metric | Score (/10) |
|---|---|
| Trend Strength | 4/10 |
| Momentum | 5/10 |
| Volume Support | 6/10 |
| Resistance Break Potential | 4/10 |
| Overall Technical Score | 5/10 |
⚠️ Risk Analysis
- Weak ADX indicates limited trend strength.
- Tapering volumes may result in failed price recovery.
- Downside risks if ₹4800 support is breached.
- Strong resistance at ₹5200-5400 could hinder sustainable moves higher.
Disclaimer
This analysis is for informational purposes only and should not be considered financial advice.
Analysis is based on historical data, current market trends, and technical indicators, and may not guarantee future performance.