📊 Market Overview
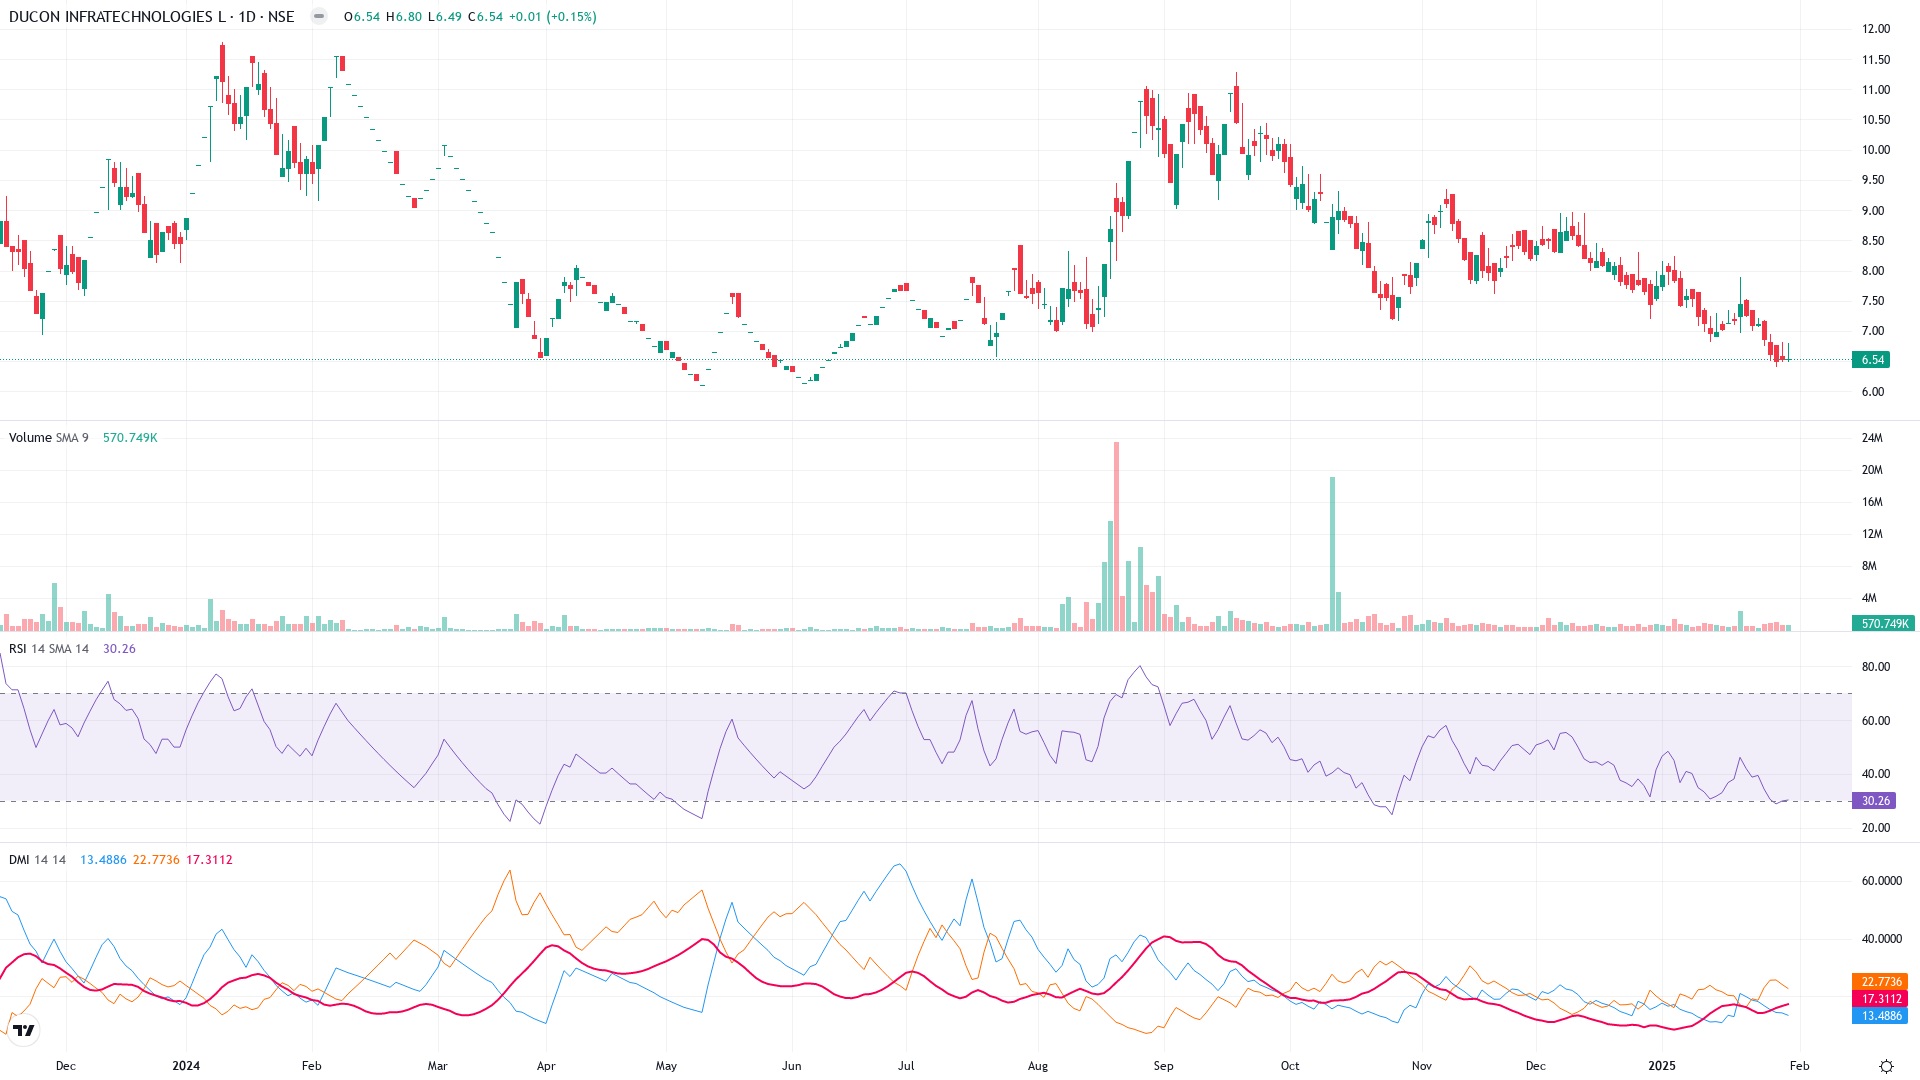
Current Price: ₹6.54 (+0.01, +0.15%)
Analysis Period: 6 Months
Trend: Bearish
- The stock peaked near ₹12 in July-August 2024 and has since experienced a steady decline.
- Key Levels:
- Support: Around ₹6.50 (current area of consolidation); next support near ₹6.00.
- Resistance: ₹7.50 and ₹9.00.
- Lower highs and lower lows have characterized the recent price movement.
- The current price rests near a critical support zone around ₹6.50.
🎯 Key Technical Analysis
💫 Price Action Dynamics
- Notable Observations:
- The stock witnessed a consistent decline post its August 2024 highs.
- The price now consolidates near its ₹6.50 support zone.
📈 Technical Indicators Breakdown
- Relative Strength Index (RSI):
- Current RSI (14): 30.26 (just above the oversold threshold).
- Downward RSI trend since August 2024 reflects ongoing bearish momentum.
- RSI near oversold levels suggests potential interest from short-term buyers.
- Directional Movement Index (DMI):
- DI+: 13.49 (weak positive strength).
- DI-: 22.77 (dominant negative strength confirms bearish momentum).
- ADX: 17.31 (indicates a weak, non-convincing bearish trend).
- Weak ADX reading suggests potential sideways or range-bound movement.
📊 Volume Analysis
- Current Volume: 570.7K (low compared to historical spikes).
- 6-Month Volume Pattern:
- July-August 2024 saw significant volume spikes during the uptrend phase.
- Since then, volumes have declined steadily, reflecting weak engagement in recent price movements.
- A lack of strong buying/selling interest suggests indecision among traders.
💪 Technical Strength Assessment
| Metric | Score (/10) |
|---|---|
| Price Action Clarity | 6 |
| Technical Indicators | 5 |
| Volume Dynamics | 4 |
| Market Sentiment | 5 |
| Trend Strength | 4 |
| Overall Technical Score | 4.8/10 |
⚠️ Risk Analysis
- Breakdown below ₹6.50 may trigger further declines towards ₹6.00 or lower.
- Weak ADX reading could result in prolonged sideways movements, reducing trading opportunities.
- Lack of volume support could further disrupt any potential bullish breakout.
- Current bearish sentiment may extinguish short-term recovery efforts without external triggers.
Disclaimer
This analysis is for informational purposes only and should not be considered financial advice. Always conduct your own research or consult with a professional before making investing or trading decisions.
- Limitations of the analysis include a reliance on historical data and the exclusion of macroeconomic factors.
- Market conditions may change rapidly, leading to outcomes that are not aligned with this analysis.