📊 Market Overview
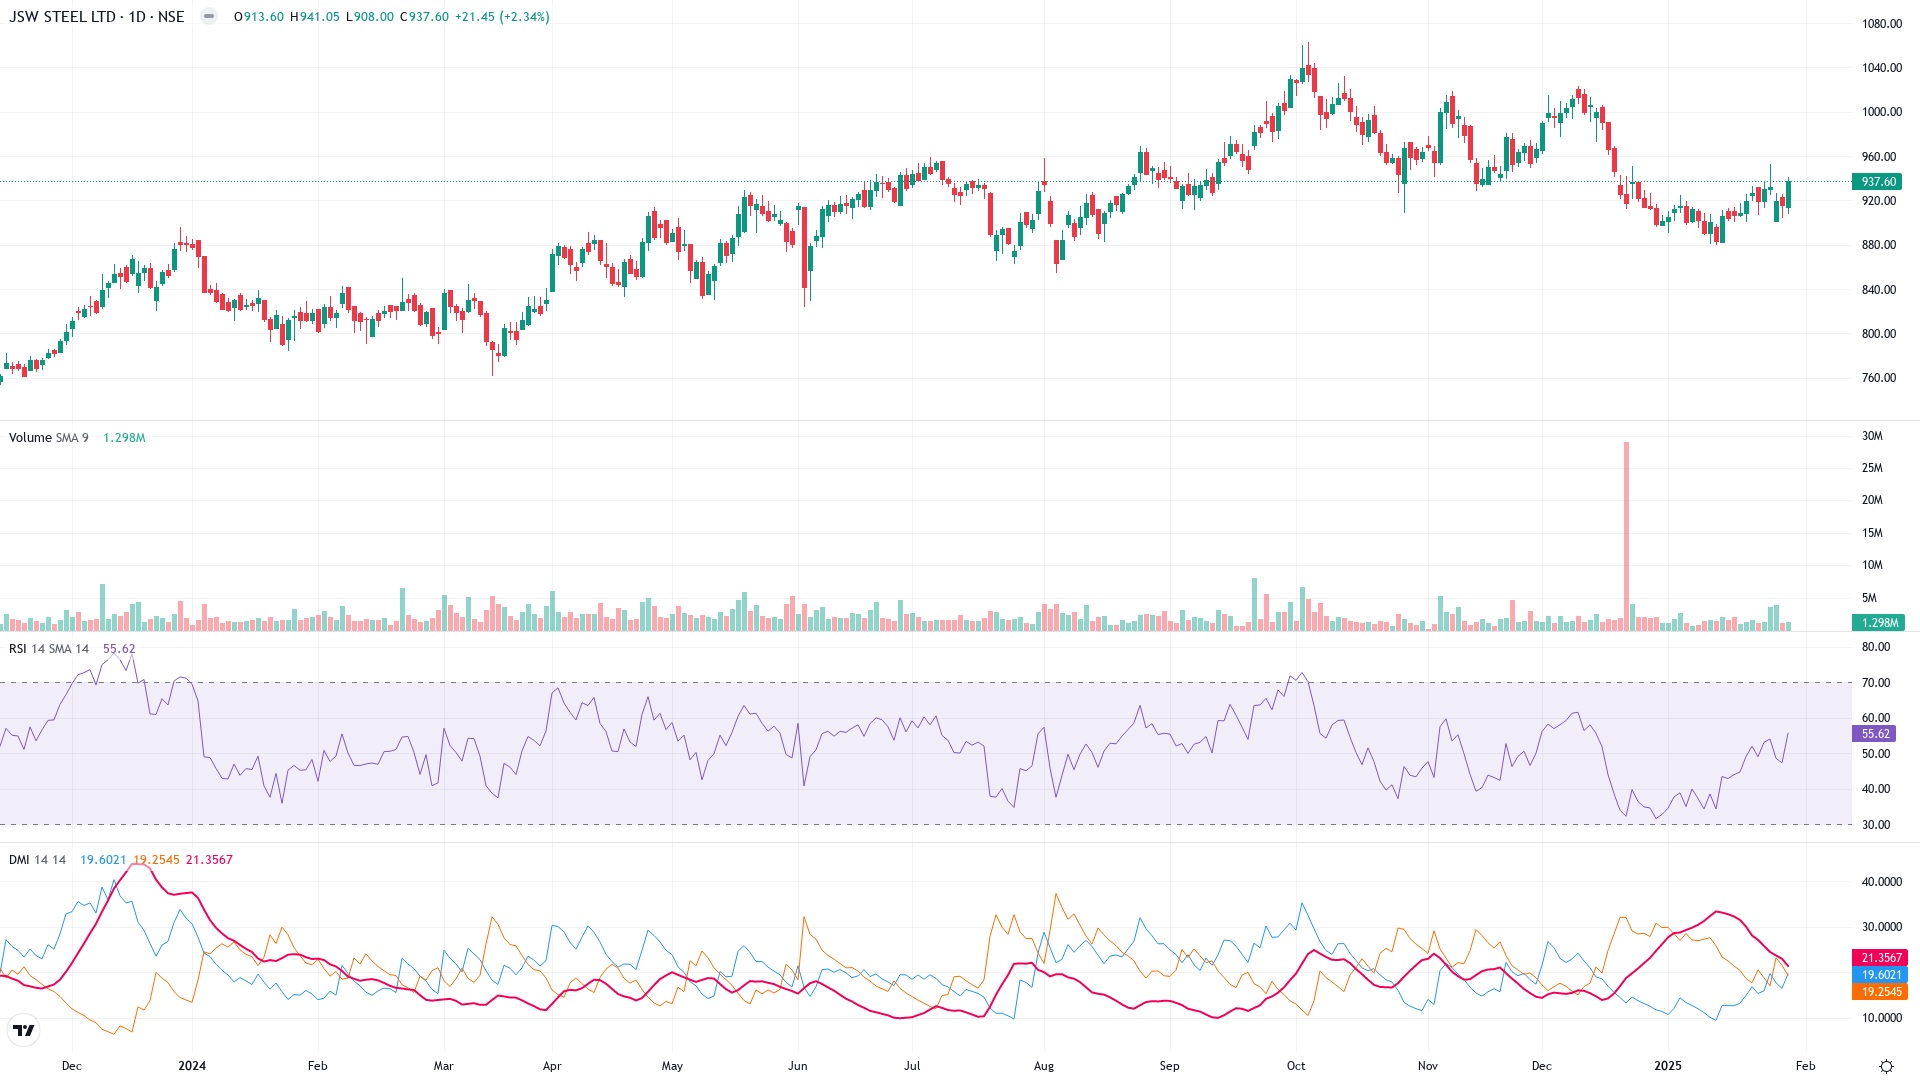
Current Price: ₹937.60 (+21.45, +2.34%)
Analysis Period: Daily Chart
🎯 Key Technical Analysis
💫 Price Action Dynamics
- The stock bounced from its recent low of approximately ₹880 in December 2024 and is currently recovering.
- 6-Month Trend: Sideways-to-bullish structure with recovery attempts after November-December losses.
- Resistance Levels: ₹960-₹980 (short-term ceiling), ₹1,000 (psychological level and prior high).
- Support Levels: ₹880-₹900 (strong demand zone), ₹850 (long-term support).
- Pattern Formation: Higher low near ₹880 suggests potential recovery. Bounce off support zone hints at bullish continuation.
📈 Technical Indicators Breakdown
- Relative Strength Index (RSI):
– Current RSI (14): 55.62
– RSI above 50 signals bullish momentum.
– Still below overbought zone (>70), indicating room for further upside. - Directional Movement Index (DMI):
– +DI: 19.60, -DI: 19.25, ADX: 21.35.
– +DI slightly higher than -DI, signaling growing bullish momentum.
– ADX suggests a weak overall trend but potential for strengthening if upward momentum is sustained.
📊 Volume Analysis
- Current Volume: ~1.298M (average daily levels).
- November/December sell-off accompanied by higher volumes, but recent recovery lacks volume surge, causing concern about sustainability.
- Breakout above ₹960 with increased volume would confirm bullish strength.
💪 Technical Strength Assessment
| Metric | Score (/10) |
|---|---|
| Price Action | 7/10 |
| RSI Momentum | 6/10 |
| DMI Trend Strength | 5/10 |
| Volume Confirmation | 4/10 |
| Overall Technical Score | 5.5/10 |
⚠️ Risk Analysis
- Failure to sustain above ₹900-₹920 could lead to renewed selling pressure.
- Weak ADX readings show lack of conviction in recovery.
- Break below ₹880 could lead to a test of ₹850 or lower levels.
Disclaimer
This analysis is for informational purposes only and should not be considered financial advice. Please conduct your own research or consult a financial advisor before making investment decisions.
- Price action and indicator signals are subject to change based on market conditions.
- Technical analysis does not guarantee future performance. Always consider external factors, including news events and overall market sentiment.