📊 Market Overview
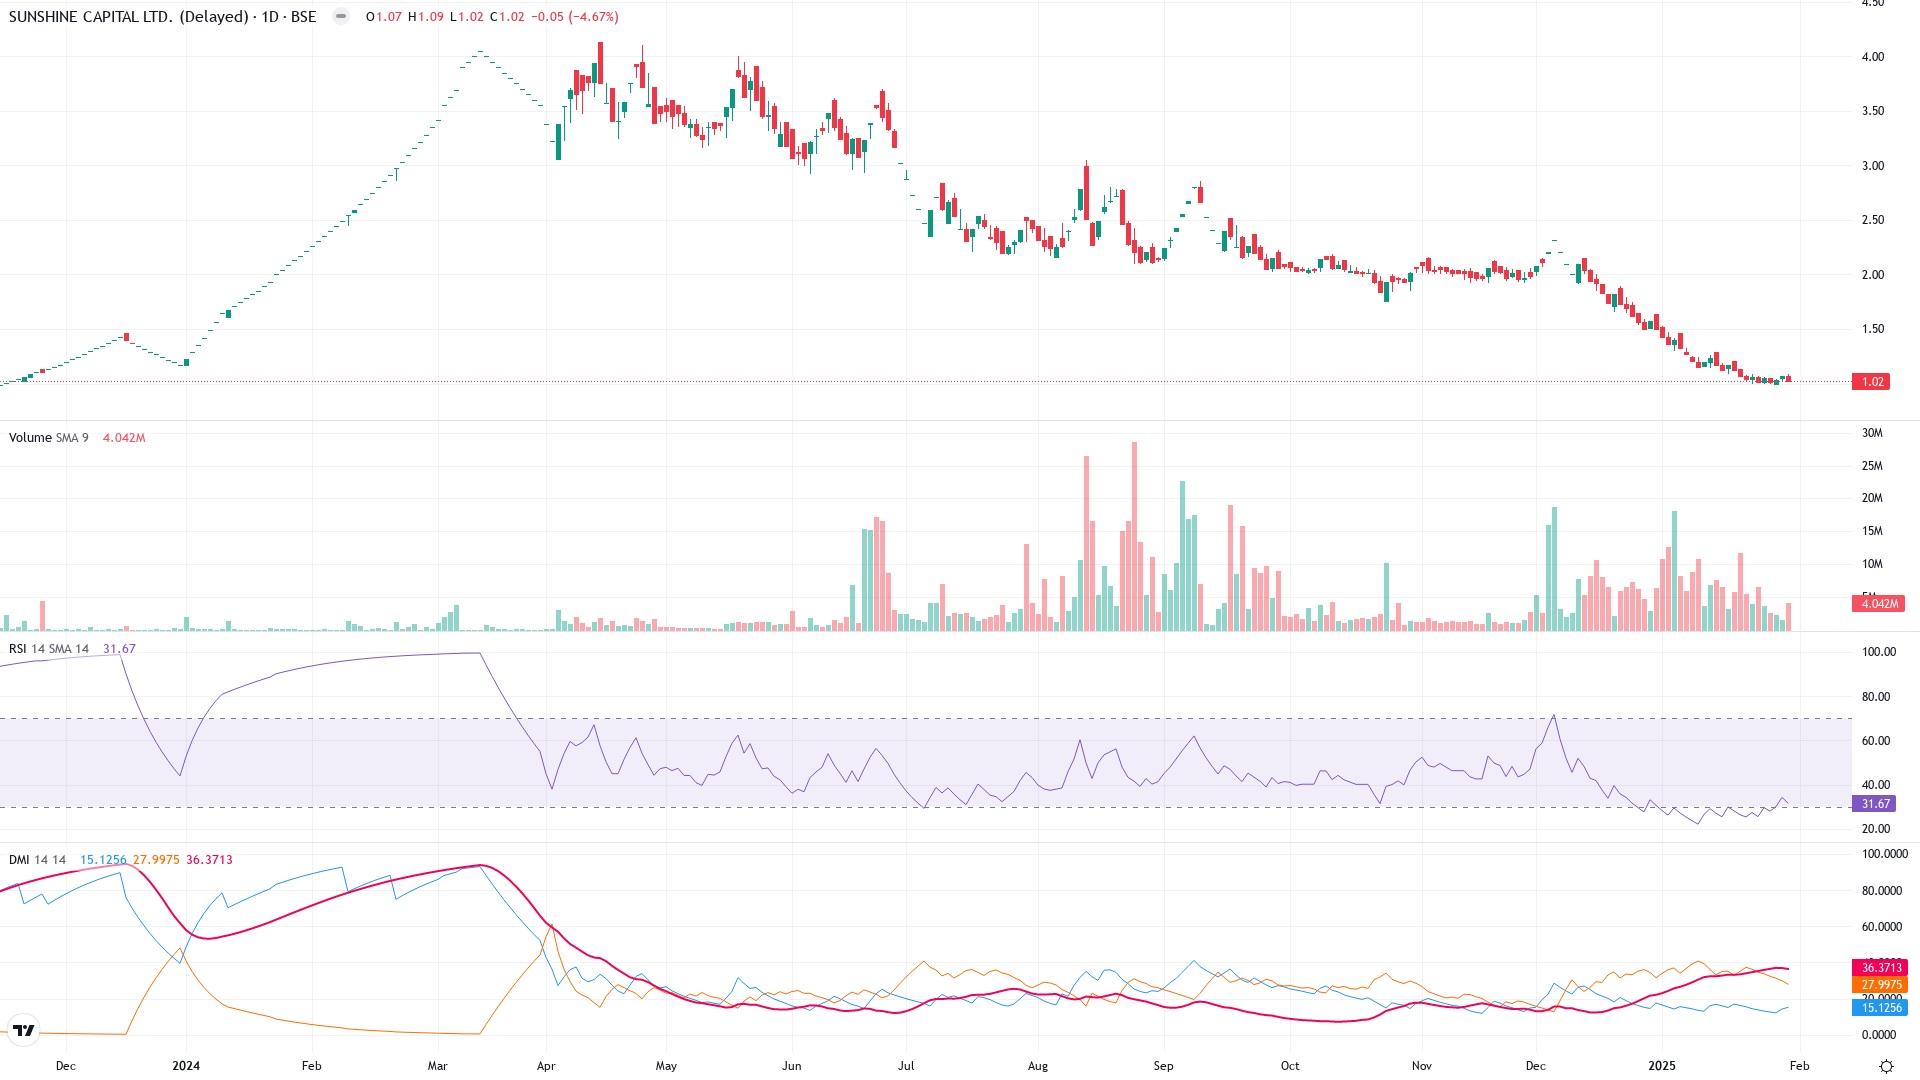
Current Price: ₹1.02 (-4.67%, down ₹0.05)
Analysis Period: Approx. 1 year (Late 2023 – Early 2025)
🎯 Key Technical Analysis
💫 Price Action Dynamics
Trend: The stock shows a heavy downtrend from its peak near ₹4.50 early in 2024 to the current price near ₹1.02.
Significant Decline: The stock has lost approximately 77% of its value since its peak.
Recent Behavior: The price is consolidating near ₹1 with significantly lower volatility compared to earlier periods.
- Resistance Levels: ₹1.50 and ₹2.00 (breakout levels for any bullish recovery attempt)
- Support Level: Psychological ₹1.00 (critical level; break below this can accelerate losses)
📈 Technical Indicators Breakdown
1. Relative Strength Index (RSI)
Current RSI: 31.67 (near oversold territory)
Trend: RSI declined sharply during the downtrend, with no signs of momentum recovery.
- RSI is hovering near oversold levels (<30-40), indicating weak momentum.
- No recent divergence or bullish signals yet.
2. Directional Movement Index (DMI)
Current DI+: 15.12 vs DI-: 36.37
Observation: DI- dominance suggests a strong downtrend is still in play.
ADX: 27.99 (Moderate trend strength increasing from earlier periods)
DMI Trend: Historical crossovers confirm the extended downward momentum since mid-2024.
📊 Volume Analysis
- Volume Profile: Significant volume spikes in early 2024 during the uptrend, followed by high sell-side volumes from April to September 2024.
- Recent Volume: Subdued daily volumes with no significant accumulation.
- Interpretation: Lack of buyer interest indicates weakness. However, seller exhaustion may occur if volumes continue to decline further at low prices.
💪 Technical Strength Assessment
| Metric | Score (out of 10) |
|---|---|
| Trend Strength | 3/10 |
| Volume Setup | 4/10 |
| Oversold Condition | 5/10 |
| Overall Score | 4/10 |
⚠️ Risk Analysis
- Upside Potential: A breakout above ₹1.50 could invite buyers and attempt recovery toward ₹2.00.
- Downside Risk: Breach of ₹1.00 may lead to further declines, likely toward ₹0.80 or lower due to lack of historical support levels.
- Volume Concern: Low overall activity suggests the absence of strong institutional interest.
Disclaimer
This technical analysis is based on historical data and purely reflects the author’s interpretation of technical indicators. Past performance is not indicative of future results.
- Limitations of this analysis: It does not account for macroeconomic conditions, news events, or fundamental factors affecting the company.